PC crashes and terrible fps in games

fairiefools

Member
Hi im hoping for some advice :)) right off the bat ill say i really dont know much about pcs and i have only recently bought one a few months ago which some kind people on here help me put together. I have noticed that it doesnt really seem to be performing how i expected it to but it never really was too much of an issue in the games i was playing but it was definitely not optimal but i just ignored it until recently i was gifted Hogwarts Legacy and my average fps is 14.8fps which is very disappointing, ive done everything to try and boost it to my knowledge im playing on low graphics i have turned vsync on in AMD and turned it the ingame version off as my friend told me that should help and occasionally my pc just crashes (not a lot but enough for me to question) but i dont know what to do!!! please help!!

here are my specs

Processor (CPU)
AMD Ryzen 5 7600 Six Core CPU (4.0GHz-5.2GHz/38MB CACHE/AM5)
Motherboard
ASUS® TUF GAMING B650-PLUS WIFI (DDR5, USB 3.2, 6Gb/s)
Memory (RAM)
32GB Corsair VENGEANCE DDR5 5600MHz (2 x 16GB)
Graphics Card
12GB AMD RADEON™ RX 6700 XT - HDMI, DP - DX® 12
1st M.2 SSD Drive
512GB SOLIDIGM P44 PRO GEN 4 M.2 NVMe PCIe SSD (up to 7000MB/sR, 4700MB/sW)
1st M.2 SSD Drive
1TB INTEL® 670p M.2 NVMe PCIe SSD (up to 3500MB/sR | 2500MB/sW)
Power Supply
CORSAIR 750W RMe SERIES™ MODULAR 80 PLUS® GOLD, ULTRA QUIET
Power Cable
1 x 1.5 Metre UK Power Cable (Kettle Lead)
Processor Cooling
DeepCool AK400 Performance CPU Cooler
Thermal Paste
ARCTIC MX-4 EXTREME THERMAL CONDUCTIVITY COMPOUND

MONITOR:

Gigabyte 27" G27Q 2560x1440 IPS 144Hz 1ms FreeSync/G-Sync Compatible LED Backlit Widescreen Gamin
 

SpyderTracks

We love you Ukraine
I take it you’ve optimised settings in the game? Or are you just trying to run at max settings? Hogwarts is really poorly optimised and you’ll need to adjust settings to get it to play.

This is the case with any game really.

If you google the game and “optimised settings” you’ll get recommended adjustments per resolution.

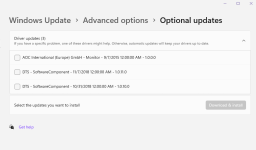
Also, what anti virus are you running? Are all your optional updates installed?
 

fairiefools

Member
i have i have watched a few youtube videos and optimised my settings to what they said and to the resolution of my monitor with all my graphics settings on low and even adjusted my amd setting to be the optimised settings

I believe im just using windows anti virus at the moment and windows is fully updated as well as all my graphics drivers i also make sure that all background applications are closed when playing
 

SpyderTracks

We love you Ukraine
i have i have watched a few youtube videos and optimised my settings to what they said and to the resolution of my monitor with all my graphics settings on low and even adjusted my amd setting to be the optimised settings

I believe im just using windows anti virus at the moment and windows is fully updated as well as all my graphics drivers i also make sure that all background applications are closed when playing
Can you take a screenshot of your optional updates page?
 

fairiefools

Member

Attachments

  • 57A1FB65-406A-454A-A3EE-6D7759F3A846.png
    57A1FB65-406A-454A-A3EE-6D7759F3A846.png
    14.6 KB · Views: 101

fairiefools

Member
You’ll need to install all those.

Do you have a link to the graphics suggestions you chose?
okay ive downloaded those

for the amd settings it was this:

for the game settings it was this except i turned all them down to low when it still wasnt performing:


SpyderTracks

We love you Ukraine
okay ive downloaded those

for the amd settings it was this:

for the game settings it was this except i turned all them down to low when it still wasnt performing:

That’s a different gpu and resolution.

But firstly we need to be sure software is setup correctly, if you can upload the following?


ubuysa

The BSOD Doctor
Only Superman has X-Ray vision.......

These dumps are quite interesting and they may point in two different directions - although there will be a common cause. Of the five dumps, four are identical and are 0x50 - PAGE_FAULT_IN_NONPAGED_AREA bugchecks, which means that a page that was supposed to be in RAM (in the non-pageable pool) was not found. The failure bucket blames amdkmdag.sys, your graphics driver...
Code:
FAILURE_BUCKET_ID:  AV_INVALID_amdkmdag!unknown_function
The 'unknown function' suffix means that a function in the driver (amdkmdag.sys) was called but the function didn't exist. That's often a driver error, the function pointers were corrupted or a genuine unknown function was called. The call stack supports this hypothesis...
Code:
1: kd> !dpx
Start memory scan  : 0xffffa40e9c6165e8 ($csp)
End memory scan    : 0xffffa40e9c618000 (Kernel Stack Base)

               r11 : 0xffffa40e9c616568 : 0xfffff80472c6ae78 : nt!MiSynchronizeSystemVa+0x358
0xffffa40e9c6166e8 : 0xfffff80472c401dc : nt!MmAccessFault+0x29c
0xffffa40e9c616718 : 0xfffff80472c432f8 : nt!KeWaitForSingleObject+0x318
0xffffa40e9c6167c8 : 0xfffff80473129d53 : nt!ObpCloseHandle+0x2c3
0xffffa40e9c616808 : 0xfffff80472e42d29 : nt!KiPageFault+0x369
0xffffa40e9c616810 : 0x0000000000000000 :  Trap @ ffffa40e9c616810
0xffffa40e9c616e08 : 0xfffff804c3630000 : amdkmdag
0xffffa40e9c6171b8 : 0xfffff804a778fce5 : dxgkrnl!DpiDxgkDdiSetPowerState+0x59
0xffffa40e9c6171c8 : 0xfffff80472d28b20 : nt!PoHandleIrp+0xa8
0xffffa40e9c617218 : 0xfffff804a778faff : dxgkrnl!DpiFdoSetAdapterPowerState+0x2af
0xffffa40e9c617238 : 0xfffff80472d28a63 : nt!IopPoHandleIrp+0x3b
0xffffa40e9c617268 : 0xfffff80472cb3efd : nt!IofCallDriver+0x6d
0xffffa40e9c617298 : 0xfffff80472c43cf8 : nt!ExAcquireResourceExclusiveLite+0x28
0xffffa40e9c6172d8 : 0xfffff804a778f6f0 : dxgkrnl!DpiFdoHandleDevicePower+0x2c0
0xffffa40e9c617378 : 0xfffff804a778ef91 : dxgkrnl!DpiFdoDispatchPower+0x21
0xffffa40e9c6173a0 : 0xfffff804a778ef70 : dxgkrnl!DpiFdoDispatchPower
0xffffa40e9c6173a8 : 0xfffff804a77909c0 : dxgkrnl!DpiDispatchPower+0xe0
0xffffa40e9c617428 : 0xfffff80472d279e0 : nt!PopRequestCompletion
0xffffa40e9c617478 : 0xfffff80472d279e0 : nt!PopRequestCompletion
0xffffa40e9c6174c8 : 0xfffff80472d2883c : nt!PopIrpWorker+0x21c
0xffffa40e9c617508 : 0xfffff8047363d1b0 : nt!PopIrpLock
0xffffa40e9c617520 : 0xfffff8047363a130 : nt!PopIrpThreadList
0xffffa40e9c617568 : 0xfffff80472c12667 : nt!PspSystemThreadStartup+0x57
0xffffa40e9c617578 : 0xfffff80472d28620 : nt!PopIrpWorker
0xffffa40e9c6175b8 : 0xfffff80472e370a4 : nt!KiStartSystemThread+0x34
0xffffa40e9c6175d0 : 0xfffff80472c12610 : nt!PspSystemThreadStartup
You can see the call to amdkmdag.sys immediately followed by a page fault (you read these stacks from the bottom up). The version of amdamkdag.sys that you have installed appears current...
Code:
1: kd> lmDvm amdkmdag
Browse full module list
start             end                 module name
fffff804`c3630000 fffff804`c95ee000   amdkmdag T (no symbols)          
    Loaded symbol image file: amdkmdag.sys
    Image path: amdkmdag.sys
    Image name: amdkmdag.sys
    Browse all global symbols  functions  data
    Timestamp:        Wed Aug 23 23:33:22 2023 (64E66D12)
    CheckSum:         05F7B4EA
    ImageSize:        05FBE000
    Translations:     0000.04b0 0000.04e4 0409.04b0 0409.04e4
    Information from resource tables:
Although it's always worth checking for a more recent driver.

However, the fifth dumps suggests that the graphics driver may not be at fault. This dump is a 0x4E - PFN_LIST_CORRUPT bugcheck. The PFN is the Page Frame Number list, the list of pages in RAM...
Code:
PFN_LIST_CORRUPT (4e)
Typically caused by drivers passing bad memory descriptor lists (ie: calling
MmUnlockPages twice with the same list, etc).  If a kernel debugger is
available get the stack trace.
Arguments:
Arg1: 000000000000008d,
Arg2: 0000000000019860
Arg3: 0000000000410001
Arg4: ffff800840f4afc8
The argument 1 value of 0x8D indicates that the page-free list is corrupted and this is almost always a hardware problem, typically with RAM. The call stack of this dump contains no non-Microsoft drivers and that's another indication of a hardware problem.

You need to test your RAM in the first instance, that's where I suspect the problem lies. You have two choices...
  • Remove one stick of RAM and run on just 16GB for a few days. If it BSODs then swap sticks and run on just the other stick. This is 100% guaranteed to reveal a flaky stick of RAM.
  • Download Memtest86 (free) and use the imageUSB.exe tool extracted from the download to make a bootable USB drive containing Memtest86 (1GB is plenty big enough). If you can, do this on a different PC because we can't fully trust yours. Then, on your PC, boot this USB drive. Memtest86 will start running as soon as it boots, if no errors are found after the four iterations of the 13 different tests that the free version does, then restart Memtes86 and do another four iterations. This will find about 95% of potential RAM problems.
Let us know how the RAM testing goes.
 

fairiefools

Member
Only Superman has X-Ray vision.......

These dumps are quite interesting and they may point in two different directions - although there will be a common cause. Of the five dumps, four are identical and are 0x50 - PAGE_FAULT_IN_NONPAGED_AREA bugchecks, which means that a page that was supposed to be in RAM (in the non-pageable pool) was not found. The failure bucket blames amdkmdag.sys, your graphics driver...
Code:
FAILURE_BUCKET_ID:  AV_INVALID_amdkmdag!unknown_function
The 'unknown function' suffix means that a function in the driver (amdkmdag.sys) was called but the function didn't exist. That's often a driver error, the function pointers were corrupted or a genuine unknown function was called. The call stack supports this hypothesis...
Code:
1: kd> !dpx
Start memory scan  : 0xffffa40e9c6165e8 ($csp)
End memory scan    : 0xffffa40e9c618000 (Kernel Stack Base)

               r11 : 0xffffa40e9c616568 : 0xfffff80472c6ae78 : nt!MiSynchronizeSystemVa+0x358
0xffffa40e9c6166e8 : 0xfffff80472c401dc : nt!MmAccessFault+0x29c
0xffffa40e9c616718 : 0xfffff80472c432f8 : nt!KeWaitForSingleObject+0x318
0xffffa40e9c6167c8 : 0xfffff80473129d53 : nt!ObpCloseHandle+0x2c3
0xffffa40e9c616808 : 0xfffff80472e42d29 : nt!KiPageFault+0x369
0xffffa40e9c616810 : 0x0000000000000000 :  Trap @ ffffa40e9c616810
0xffffa40e9c616e08 : 0xfffff804c3630000 : amdkmdag
0xffffa40e9c6171b8 : 0xfffff804a778fce5 : dxgkrnl!DpiDxgkDdiSetPowerState+0x59
0xffffa40e9c6171c8 : 0xfffff80472d28b20 : nt!PoHandleIrp+0xa8
0xffffa40e9c617218 : 0xfffff804a778faff : dxgkrnl!DpiFdoSetAdapterPowerState+0x2af
0xffffa40e9c617238 : 0xfffff80472d28a63 : nt!IopPoHandleIrp+0x3b
0xffffa40e9c617268 : 0xfffff80472cb3efd : nt!IofCallDriver+0x6d
0xffffa40e9c617298 : 0xfffff80472c43cf8 : nt!ExAcquireResourceExclusiveLite+0x28
0xffffa40e9c6172d8 : 0xfffff804a778f6f0 : dxgkrnl!DpiFdoHandleDevicePower+0x2c0
0xffffa40e9c617378 : 0xfffff804a778ef91 : dxgkrnl!DpiFdoDispatchPower+0x21
0xffffa40e9c6173a0 : 0xfffff804a778ef70 : dxgkrnl!DpiFdoDispatchPower
0xffffa40e9c6173a8 : 0xfffff804a77909c0 : dxgkrnl!DpiDispatchPower+0xe0
0xffffa40e9c617428 : 0xfffff80472d279e0 : nt!PopRequestCompletion
0xffffa40e9c617478 : 0xfffff80472d279e0 : nt!PopRequestCompletion
0xffffa40e9c6174c8 : 0xfffff80472d2883c : nt!PopIrpWorker+0x21c
0xffffa40e9c617508 : 0xfffff8047363d1b0 : nt!PopIrpLock
0xffffa40e9c617520 : 0xfffff8047363a130 : nt!PopIrpThreadList
0xffffa40e9c617568 : 0xfffff80472c12667 : nt!PspSystemThreadStartup+0x57
0xffffa40e9c617578 : 0xfffff80472d28620 : nt!PopIrpWorker
0xffffa40e9c6175b8 : 0xfffff80472e370a4 : nt!KiStartSystemThread+0x34
0xffffa40e9c6175d0 : 0xfffff80472c12610 : nt!PspSystemThreadStartup
You can see the call to amdkmdag.sys immediately followed by a page fault (you read these stacks from the bottom up). The version of amdamkdag.sys that you have installed appears current...
Code:
1: kd> lmDvm amdkmdag
Browse full module list
start             end                 module name
fffff804`c3630000 fffff804`c95ee000   amdkmdag T (no symbols)         
    Loaded symbol image file: amdkmdag.sys
    Image path: amdkmdag.sys
    Image name: amdkmdag.sys
    Browse all global symbols  functions  data
    Timestamp:        Wed Aug 23 23:33:22 2023 (64E66D12)
    CheckSum:         05F7B4EA
    ImageSize:        05FBE000
    Translations:     0000.04b0 0000.04e4 0409.04b0 0409.04e4
    Information from resource tables:
Although it's always worth checking for a more recent driver.

However, the fifth dumps suggests that the graphics driver may not be at fault. This dump is a 0x4E - PFN_LIST_CORRUPT bugcheck. The PFN is the Page Frame Number list, the list of pages in RAM...
Code:
PFN_LIST_CORRUPT (4e)
Typically caused by drivers passing bad memory descriptor lists (ie: calling
MmUnlockPages twice with the same list, etc).  If a kernel debugger is
available get the stack trace.
Arguments:
Arg1: 000000000000008d,
Arg2: 0000000000019860
Arg3: 0000000000410001
Arg4: ffff800840f4afc8
The argument 1 value of 0x8D indicates that the page-free list is corrupted and this is almost always a hardware problem, typically with RAM. The call stack of this dump contains no non-Microsoft drivers and that's another indication of a hardware problem.

You need to test your RAM in the first instance, that's where I suspect the problem lies. You have two choices...
  • Remove one stick of RAM and run on just 16GB for a few days. If it BSODs then swap sticks and run on just the other stick. This is 100% guaranteed to reveal a flaky stick of RAM.
  • Download Memtest86 (free) and use the imageUSB.exe tool extracted from the download to make a bootable USB drive containing Memtest86 (1GB is plenty big enough). If you can, do this on a different PC because we can't fully trust yours. Then, on your PC, boot this USB drive. Memtest86 will start running as soon as it boots, if no errors are found after the four iterations of the 13 different tests that the free version does, then restart Memtes86 and do another four iterations. This will find about 95% of potential RAM problems.
Let us know how the RAM testing goes.
Hi so i am trying to do this memtest today and ive downloaded it all onto a usb and got to this step but i cannot see the option for the usb its telling me to run, any ideas? :))
 
Top