ubuysa
The BSOD Doctor
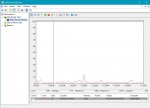
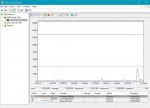
The Windows Performance Monitor is an incredibly useful tool and yet few users even know that it exists. As the name suggests the Performance Monitor (or perfmon for short) reports on your system's performance, but the detail that can be produced varies from tracking a single variable (like % CPU usage for example) to a very detailed report on the performance aspects of the most minute components of your system. (Note that you must be a member of the Administrators group to use perfmon).
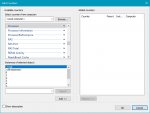
Perfmon is flexible and configurable, it uses data collectors that run in the background collecting data as you use your computer. You can specify exactly what values (perfmon calls them 'counters') you want to sample and over what period of time. For example, you could sample the time an individual logical processor spends handling interrupts, or the utilisation percentage of your GPU engine, or even the resident bytes in the system paged pool. There are a huge number of counters that you can record, and at an individual resource level. The results can be studied at your leisure and you can drill down as deep as your knowledge can take you to analyse what is causing any performance issues you might be having.
Perfmon is such a useful tool for all users that I thought it would be useful to write a few tutorials on how to use it and what it can do for you. I'm not claiming to be a perfmon expert, there are features of it that I haven't used yet, so additions and updates to this thread by others is welcome.
We'll start with the simplest (but still very useful) feature of perfmon; the System Diagnostics report, also known as a System Health report.
Unfortunately, the April 2018 version of Windows 10 (1803) breaks the System Diagnostic report a tad (and the Performance Report too). The Memory and Network status is not shown in the Resource Overview sub-section and the Memory section is missing altogether. This has been reported to Microsoft, hopefully a fix won't be too long in coming.
The October 2018 Update (1809) does not fix this issue, the Memory and Network status is still not shown in the Resource Overview sub-section and the Memory section is also still missing in Windows 10 1809.
The May 2019 Update (1903) does not fix this issue either, the Memory and Network status is still not shown in the Resource Overview sub-section and the Memory section is also still missing in Windows 10 1903.
The November 2019 Update (1909) does not fix this issue either, the Memory and Network status is still not shown in the Resource Overview sub-section and the Memory section is also still missing in Windows 10 1909.
The examples shown here were produced on a Windows 10 Anniversary Edition (1607) system running in a virtual machine.
System Diagnostics Report
A very useful feature of perfmon (that all users might be interested in) is the System Diagnostics report (it's also known as a System Health report). This runs a pre-defined set of data collectors that run for 60-seconds and produces a very detailed report on almost every aspect of your system. It's extremely useful for checking whether you have any issues than needs investigating and/or whether there are any performance bottlenecks in your system (identified during the 60-second data collection period only of course).
The beauty of the System Diagnostics report is that you don't need to configure anything, you just start it and wait for it to produce the report. The report it produces is multi-level and quite easy to read at the high level you first see (it even uses a simple traffic light system) but you can drill down to look at some fairly detailed information should you want to (or need to).
Running the System Diagnostics Report
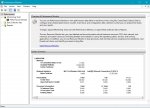
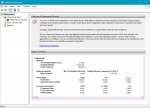
To start the System Health Report enter 'perfmon /report' (without the quotes) in the Run command box and click Ok. The System Health Report will now run for 60 seconds and then show you the report. Whilst the data collector is running you will see this window...
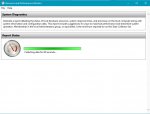
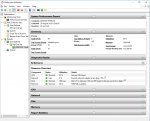
When the data collectors finish you'll see a message on the above window telling you that's it's producing the report. After a time (which can be many seconds, or even minutes on a slower system) the display changes to show the report, this looks something like the following...

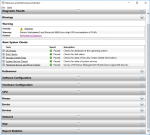
You can see that the top two sections (System Diagnostic Report and Diagnostic Results) are already expanded and that the other sections are not expanded. These top two sections give you a good overview of your system health and if all is well here you need look no further.
The System Diagnostics Report section simply tells you when the report was produced and on which computer. Note that I ran this one on a newly installed Windows 10 Home system in a virtual machine with only 4GB of RAM and a single processor (so performance is pretty poor).
The Diagnostic Results section has two sub-sections; Warnings and Performance. In the Warnings section there is an Error and Informational sub-section (and there could be a Warnings or even a Critical one too) - these are the same message groups you would see in the Event Viewer. There is also a Basic System Checks sub-section - this has a traffic light results column to help you see whether you have any problems in these areas.
In my example above there is an error related to missing device drivers, if I click on the Symptom hyperlink next to the red X I'm taken to a more detailed area of the report where the devices with missing drivers are detailed. You can see this report below...

This clearly shows that the problem is with a Plug & Play device but apart from that it's not very helpful. The device itself does show the Ven and Dev numbers (80EE and CAFE respectively) and it's possible to look these up online. VEN_80EE and DEV_CAFE is actually a component of VirtualBox, the virtual machine system I was using!
The Critical, Error, Informational, and Warnings sub-sections allows you to quickly investigate problems that have been logged to the Event Viewer. Critical and Error messages here need to be investigated further, Informational and Warning messages are much less of a problem and in the main can be ignored.
The Basic System Checks sub-section shows you five areas with a traffic light in the result column to let you decide whether any further analysis is needed. In my example above there is a red traffic light next to the Hardware and Driver Checks, so I could click on the + next to it to expand this section to get more detailed information. In this case we'd see the various test groups performed and how many failed (in my example it was a plug & play device test that failed - which we already know from the Error above).
You can of course click on the + next to any of these checks to expand the entry, but with the green traffic light there will be no failures in there.
In the Performance section (which you can see below) there is a Resource Overview sub-section with a traffic light status to show you whether any of the displayed resources were under stress. In my example below you can see a red light for the CPU showing that it's 81% busy (which might or might not be a problem, it depends whether you were expecting it). This sub-section lets you quickly see whether you need to expand any of the CPU, Network, Disk, or Memory sections you see below here. Clearly I'm going to need to expand the CPU section later.

Each of the sections below here are collapsed at the moment, you can of course expand any (or all) of them. Inside each you'll find sub-sections with entries that can also be expanded (look for the + sign) to drill down for more detailed information.
The first of these is the Software Configuration section. In here are four sub-sections called OS Checks, Security Centre Information, System Services, and Startup Programs, each of these can be expanded. When you run perfmon /report yourself expand these sections in your report to see the wealth of information contained in there. Admittedly not all of it is easily understood or even intelligible(!) but there are some useful nuggets of information buried in there such as, whether you did a normal boot or a specialised boot, how many processors you have and how much memory you have for example.
The Hardware Configuration section has five sub-sections called Disk Checks, System, Desktop Rating, BIOS, and Devices. Each of these can be expanded of course and the entries within further expanded (look for the + sign).
The CPU, Network, Disk and Memory sections expand in to sub-sections and expandable entries that allow you to see how these resources were being used during the 60-second data collection interval. The traffic lights of the Resource Overview sub-section above indicate whether you need to bother expanding any of these. In my example it would be good to see where that 81% CPU usage was being expended so I'll expand the CPU section. (In the next post)...
Perfmon is flexible and configurable, it uses data collectors that run in the background collecting data as you use your computer. You can specify exactly what values (perfmon calls them 'counters') you want to sample and over what period of time. For example, you could sample the time an individual logical processor spends handling interrupts, or the utilisation percentage of your GPU engine, or even the resident bytes in the system paged pool. There are a huge number of counters that you can record, and at an individual resource level. The results can be studied at your leisure and you can drill down as deep as your knowledge can take you to analyse what is causing any performance issues you might be having.
Perfmon is such a useful tool for all users that I thought it would be useful to write a few tutorials on how to use it and what it can do for you. I'm not claiming to be a perfmon expert, there are features of it that I haven't used yet, so additions and updates to this thread by others is welcome.
We'll start with the simplest (but still very useful) feature of perfmon; the System Diagnostics report, also known as a System Health report.
Unfortunately, the April 2018 version of Windows 10 (1803) breaks the System Diagnostic report a tad (and the Performance Report too). The Memory and Network status is not shown in the Resource Overview sub-section and the Memory section is missing altogether. This has been reported to Microsoft, hopefully a fix won't be too long in coming.
The October 2018 Update (1809) does not fix this issue, the Memory and Network status is still not shown in the Resource Overview sub-section and the Memory section is also still missing in Windows 10 1809.
The May 2019 Update (1903) does not fix this issue either, the Memory and Network status is still not shown in the Resource Overview sub-section and the Memory section is also still missing in Windows 10 1903.
The November 2019 Update (1909) does not fix this issue either, the Memory and Network status is still not shown in the Resource Overview sub-section and the Memory section is also still missing in Windows 10 1909.
The examples shown here were produced on a Windows 10 Anniversary Edition (1607) system running in a virtual machine.
System Diagnostics Report
A very useful feature of perfmon (that all users might be interested in) is the System Diagnostics report (it's also known as a System Health report). This runs a pre-defined set of data collectors that run for 60-seconds and produces a very detailed report on almost every aspect of your system. It's extremely useful for checking whether you have any issues than needs investigating and/or whether there are any performance bottlenecks in your system (identified during the 60-second data collection period only of course).
The beauty of the System Diagnostics report is that you don't need to configure anything, you just start it and wait for it to produce the report. The report it produces is multi-level and quite easy to read at the high level you first see (it even uses a simple traffic light system) but you can drill down to look at some fairly detailed information should you want to (or need to).
Running the System Diagnostics Report
To start the System Health Report enter 'perfmon /report' (without the quotes) in the Run command box and click Ok. The System Health Report will now run for 60 seconds and then show you the report. Whilst the data collector is running you will see this window...

When the data collectors finish you'll see a message on the above window telling you that's it's producing the report. After a time (which can be many seconds, or even minutes on a slower system) the display changes to show the report, this looks something like the following...

You can see that the top two sections (System Diagnostic Report and Diagnostic Results) are already expanded and that the other sections are not expanded. These top two sections give you a good overview of your system health and if all is well here you need look no further.
The System Diagnostics Report section simply tells you when the report was produced and on which computer. Note that I ran this one on a newly installed Windows 10 Home system in a virtual machine with only 4GB of RAM and a single processor (so performance is pretty poor).
The Diagnostic Results section has two sub-sections; Warnings and Performance. In the Warnings section there is an Error and Informational sub-section (and there could be a Warnings or even a Critical one too) - these are the same message groups you would see in the Event Viewer. There is also a Basic System Checks sub-section - this has a traffic light results column to help you see whether you have any problems in these areas.
In my example above there is an error related to missing device drivers, if I click on the Symptom hyperlink next to the red X I'm taken to a more detailed area of the report where the devices with missing drivers are detailed. You can see this report below...

This clearly shows that the problem is with a Plug & Play device but apart from that it's not very helpful. The device itself does show the Ven and Dev numbers (80EE and CAFE respectively) and it's possible to look these up online. VEN_80EE and DEV_CAFE is actually a component of VirtualBox, the virtual machine system I was using!
The Critical, Error, Informational, and Warnings sub-sections allows you to quickly investigate problems that have been logged to the Event Viewer. Critical and Error messages here need to be investigated further, Informational and Warning messages are much less of a problem and in the main can be ignored.
The Basic System Checks sub-section shows you five areas with a traffic light in the result column to let you decide whether any further analysis is needed. In my example above there is a red traffic light next to the Hardware and Driver Checks, so I could click on the + next to it to expand this section to get more detailed information. In this case we'd see the various test groups performed and how many failed (in my example it was a plug & play device test that failed - which we already know from the Error above).
You can of course click on the + next to any of these checks to expand the entry, but with the green traffic light there will be no failures in there.
In the Performance section (which you can see below) there is a Resource Overview sub-section with a traffic light status to show you whether any of the displayed resources were under stress. In my example below you can see a red light for the CPU showing that it's 81% busy (which might or might not be a problem, it depends whether you were expecting it). This sub-section lets you quickly see whether you need to expand any of the CPU, Network, Disk, or Memory sections you see below here. Clearly I'm going to need to expand the CPU section later.

Each of the sections below here are collapsed at the moment, you can of course expand any (or all) of them. Inside each you'll find sub-sections with entries that can also be expanded (look for the + sign) to drill down for more detailed information.
The first of these is the Software Configuration section. In here are four sub-sections called OS Checks, Security Centre Information, System Services, and Startup Programs, each of these can be expanded. When you run perfmon /report yourself expand these sections in your report to see the wealth of information contained in there. Admittedly not all of it is easily understood or even intelligible(!) but there are some useful nuggets of information buried in there such as, whether you did a normal boot or a specialised boot, how many processors you have and how much memory you have for example.
The Hardware Configuration section has five sub-sections called Disk Checks, System, Desktop Rating, BIOS, and Devices. Each of these can be expanded of course and the entries within further expanded (look for the + sign).
The CPU, Network, Disk and Memory sections expand in to sub-sections and expandable entries that allow you to see how these resources were being used during the 60-second data collection interval. The traffic lights of the Resource Overview sub-section above indicate whether you need to bother expanding any of these. In my example it would be good to see where that 81% CPU usage was being expended so I'll expand the CPU section. (In the next post)...
Last edited:


