ubuysa
The BSOD Doctor
Windows logs everything, and I really do mean everything, the volume of log records produced on a normally running Windows system is monumental. Most of them simply tell you that some ordinary (and perfectly normal) event has occurred. For example, when the user logs on a log record it written to record that event. As you might expect then, something like 95% of all log records don't indicate a problem at all, they simply record that some normal event occurred. The other 5% however do indicate problems, and some of them could be serious.
The tool that Microsoft provides for you to examine all the Windows logs (and there are many different logs) is called the Event Viewer, unfortunately it's not the most intuitive tool Microsoft has ever provided. Being able to extract useful information from the Windows logs is often a useful step in problem determination however, even if you can't fully interpret the log messages yourself you can copy what you think are the relevant log entries and post them to the PCS fora for the more experienced members to look at for you.
The Event Viewer
The easiest way to start the Event Viewer is to type 'eventvwr' in the Run command box. After it's started there will be a delay (which can be some minutes on a slower system) while the numerous logs are read and the Event Viewer is populated, you must wait for this process to complete before trying to use the Event Viewer. An example of the Event Viewer 'home' screen is shown below...
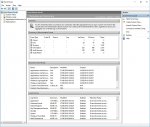
There are three frames to the Event Viewer screen; to the left is a folder tree structure for navigating the various logs, in the centre is the main log display, and on the right are a list of actions that you can take (the list of actions varies depending on where you are in the Event Viewer).
Initially the folder tree structure on the left is collapsed and the root (Event Viewer (Local)) is selected. We'll look at using this folder tree structure shortly.
The right-hand frame (the actions frame) has only a few basic actions displayed at the moment. We'll look at using some of these actions a little later.
The centre frame (called 'Overview and Summary') is divided into four panes; Overview, Summary of Administrative Events, Recently Viewed Nodes, and Log Summary. The small black up-arrow to the right of each of these panes can be used to collapse that pane and leave more room for the others.
The Overview pane only contains some very basic information about the Event Viewer and (after you've read it of course) this pane can be collapsed to create more viewing space.
The pane at the bottom, Log Summary lists all of the logs available, and not all of these will be Windows related. Third-party applications can (and often do) make their logs available to the Event Viewer, this is a good thing because it means that all your logging data is in one place. If you scroll down the list of logs here you can see the log name, the current and maximum size of each log, the date the log was last written to, whether the log is enabled on this system, and the log retention policy. As you scroll down notice that many of the Windows logs are disabled, this is by design and you should only enable logging for these features if instructed to do so by Microsoft.
This is a good moment to look at the folder tree structure on the left because this also refers to individual logs.
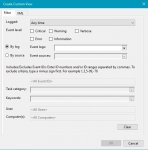
Custom Views is where you define filtered views that meet specified criteria so that if there are events you view often you can create a custom view for them. We'll look at creating custom views later.
Windows Logs is a summary view of some important logs, you can see the categories by expanding this folder. Application shows the general system (and some user) application log data, Security shows the security audit logs, Setup shows maintenance logs (update installation etc.), System shows kernel log data, and Forwarded Events shows log data that has been sent from other computers.
Applications and Services Logs is where all the various logs that Event Viewer can display are located, as you will see there are hundreds of them. Expand the 'Applications and Services Logs' folder and you'll see several overview log summary views and some expandable folders, how many and what they are called depends on your system and what's been installed - there are some basic ones though that are found on all systems. Hardware Events shows hardware log data, Internet Explorer shows log data from Internet Explorer of course, Key Management shows logs from the Key Management Service (KMS) which is related to licensing and activation, Windows PowerShell shows logs from the PowerShell tool[/U]. The expandable folder common to all systems is called Microsoft, so expand that folder. Again, how many sub-solders you see depends on your system and what's been installed but there are two expandable sub-folders common to all systems. Antimalware contains the logs from the Microsoft Antimalware Scan Interface (AMSI), and the Windows folder is where all the main logs are located. Expand the Windows folder and you'll see something similar to my example below...
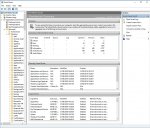
We're not going to look at each and every one of these, don't worry! You just need to know that they're here in case you ever need to look at the logs for a specific feature. For example, in my 'Using the Performance Monitor' thread I showed you where performance alerts are logged; they're in Applications and Services\Microsoft\Windows\Diagnosis-PLA\Operational. You can see a correlation between the folder names here and the list of logs in the Log Summary on the 'home' screen.
Back on the Event Viewer 'home' screen' the pane in the centre, Recently Viewed Nodes is a list of logs (nodes) that you have recently looked at. You can of course double-click on any of these to go back to logs you have been recently viewing.
The pane at the top Summary of Administrative Events is the most important pane on this display and the one you would typically look at first. It lists a count of the number of each category of log event for the last hour, the last 24 hours, and the last 7 days. Note that this summary does not show every single available log entry, only those considered to be 'administrative' logs. What filter is used to extract 'administrative' logs isn't defined publicly, but all Critical, Error and Warning log entries are 'administrative' and are shown here. Non-administrative logs, like the performance alerts I mentioned earlier, must be directly accessed via the folder tree structure. An example of this pane is shown below...

The various log categories and their meaning are...
Critical these are failures (errors) that are considered to be so important that they must be investigated.
Error these are failures (errors) that have occurred and been logged, however almost all of these failures will have been automatically recovered by Windows. If a service stops unexpectedly for example, an error event will be logged, but Windows will simply restart the service and you probably won't even notice. There are a large number of errors logged on every normal client home system, this doesn't indicate that you have problems nor that your system is starting to fail. It's normal. Windows is a very complex system and unexpected things are happening all the time (especially in user mode). Windows is very resilient and it's designed to recover from almost any error, those it can't recover from generally cause a BSOD. Note that scammers who call you pretending to be Microsoft typically talk you through opening the Event Viewer and show you the apparently large number of errors logged, they then try to scare you into thinking your system is about to fail and only they can fix it for you.
Warning these are messages logged to tell you that something unexpected happened, it didn't cause a problem but you need to know that it happened. For example, if you enter a URL into your browser and the name lookup fails for some reason (as it often can) the DNS client will write a warning log message. These warning logs can be useful if you're having issues that you can't track down, a scan through the warning logs might reveal some interesting clues.
Information, as the name implies, are messages just to tell you things that you might find useful or interesting. When a service is started for example, it logs an information message. The performance alerts I mentioned earlier are logged as information messages. Many application programs log information messages so that the developer can debug the application.
Audit Success/Failure these are logs written by the security systems in Windows to log events that have security implications. For example, if you make changes to the Windows firewall the changes you make will be logged here. Think of these as information messages from the security system.
You can see from the '+' to the left of each category that they can be expanded to show the log entry types. In my example above I've already expanded the Critical category and you can see there is only one type of error, a Kernel-Power error (we'll look at what this error actually means in a short while). You can also see that I've had two of these log entries written during the last seven days and one was written in the last hour (these are not additive of course, there are only two of these errors logged on this system).
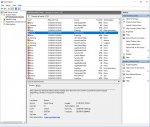
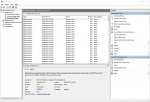
If I double-click on the Kernel-Power entry the log entries themselves are displayed, you can see this below...
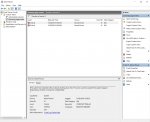
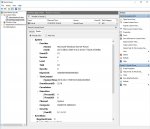
As I select each log entry the box at the bottom displays the contents of the log entry.
The tool that Microsoft provides for you to examine all the Windows logs (and there are many different logs) is called the Event Viewer, unfortunately it's not the most intuitive tool Microsoft has ever provided. Being able to extract useful information from the Windows logs is often a useful step in problem determination however, even if you can't fully interpret the log messages yourself you can copy what you think are the relevant log entries and post them to the PCS fora for the more experienced members to look at for you.
The Event Viewer
The easiest way to start the Event Viewer is to type 'eventvwr' in the Run command box. After it's started there will be a delay (which can be some minutes on a slower system) while the numerous logs are read and the Event Viewer is populated, you must wait for this process to complete before trying to use the Event Viewer. An example of the Event Viewer 'home' screen is shown below...

There are three frames to the Event Viewer screen; to the left is a folder tree structure for navigating the various logs, in the centre is the main log display, and on the right are a list of actions that you can take (the list of actions varies depending on where you are in the Event Viewer).
Initially the folder tree structure on the left is collapsed and the root (Event Viewer (Local)) is selected. We'll look at using this folder tree structure shortly.
The right-hand frame (the actions frame) has only a few basic actions displayed at the moment. We'll look at using some of these actions a little later.
The centre frame (called 'Overview and Summary') is divided into four panes; Overview, Summary of Administrative Events, Recently Viewed Nodes, and Log Summary. The small black up-arrow to the right of each of these panes can be used to collapse that pane and leave more room for the others.
The Overview pane only contains some very basic information about the Event Viewer and (after you've read it of course) this pane can be collapsed to create more viewing space.
The pane at the bottom, Log Summary lists all of the logs available, and not all of these will be Windows related. Third-party applications can (and often do) make their logs available to the Event Viewer, this is a good thing because it means that all your logging data is in one place. If you scroll down the list of logs here you can see the log name, the current and maximum size of each log, the date the log was last written to, whether the log is enabled on this system, and the log retention policy. As you scroll down notice that many of the Windows logs are disabled, this is by design and you should only enable logging for these features if instructed to do so by Microsoft.
This is a good moment to look at the folder tree structure on the left because this also refers to individual logs.
Custom Views is where you define filtered views that meet specified criteria so that if there are events you view often you can create a custom view for them. We'll look at creating custom views later.
Windows Logs is a summary view of some important logs, you can see the categories by expanding this folder. Application shows the general system (and some user) application log data, Security shows the security audit logs, Setup shows maintenance logs (update installation etc.), System shows kernel log data, and Forwarded Events shows log data that has been sent from other computers.
Applications and Services Logs is where all the various logs that Event Viewer can display are located, as you will see there are hundreds of them. Expand the 'Applications and Services Logs' folder and you'll see several overview log summary views and some expandable folders, how many and what they are called depends on your system and what's been installed - there are some basic ones though that are found on all systems. Hardware Events shows hardware log data, Internet Explorer shows log data from Internet Explorer of course, Key Management shows logs from the Key Management Service (KMS) which is related to licensing and activation, Windows PowerShell shows logs from the PowerShell tool[/U]. The expandable folder common to all systems is called Microsoft, so expand that folder. Again, how many sub-solders you see depends on your system and what's been installed but there are two expandable sub-folders common to all systems. Antimalware contains the logs from the Microsoft Antimalware Scan Interface (AMSI), and the Windows folder is where all the main logs are located. Expand the Windows folder and you'll see something similar to my example below...

We're not going to look at each and every one of these, don't worry! You just need to know that they're here in case you ever need to look at the logs for a specific feature. For example, in my 'Using the Performance Monitor' thread I showed you where performance alerts are logged; they're in Applications and Services\Microsoft\Windows\Diagnosis-PLA\Operational. You can see a correlation between the folder names here and the list of logs in the Log Summary on the 'home' screen.
Back on the Event Viewer 'home' screen' the pane in the centre, Recently Viewed Nodes is a list of logs (nodes) that you have recently looked at. You can of course double-click on any of these to go back to logs you have been recently viewing.
The pane at the top Summary of Administrative Events is the most important pane on this display and the one you would typically look at first. It lists a count of the number of each category of log event for the last hour, the last 24 hours, and the last 7 days. Note that this summary does not show every single available log entry, only those considered to be 'administrative' logs. What filter is used to extract 'administrative' logs isn't defined publicly, but all Critical, Error and Warning log entries are 'administrative' and are shown here. Non-administrative logs, like the performance alerts I mentioned earlier, must be directly accessed via the folder tree structure. An example of this pane is shown below...
The various log categories and their meaning are...
Critical these are failures (errors) that are considered to be so important that they must be investigated.
Error these are failures (errors) that have occurred and been logged, however almost all of these failures will have been automatically recovered by Windows. If a service stops unexpectedly for example, an error event will be logged, but Windows will simply restart the service and you probably won't even notice. There are a large number of errors logged on every normal client home system, this doesn't indicate that you have problems nor that your system is starting to fail. It's normal. Windows is a very complex system and unexpected things are happening all the time (especially in user mode). Windows is very resilient and it's designed to recover from almost any error, those it can't recover from generally cause a BSOD. Note that scammers who call you pretending to be Microsoft typically talk you through opening the Event Viewer and show you the apparently large number of errors logged, they then try to scare you into thinking your system is about to fail and only they can fix it for you.
Warning these are messages logged to tell you that something unexpected happened, it didn't cause a problem but you need to know that it happened. For example, if you enter a URL into your browser and the name lookup fails for some reason (as it often can) the DNS client will write a warning log message. These warning logs can be useful if you're having issues that you can't track down, a scan through the warning logs might reveal some interesting clues.
Information, as the name implies, are messages just to tell you things that you might find useful or interesting. When a service is started for example, it logs an information message. The performance alerts I mentioned earlier are logged as information messages. Many application programs log information messages so that the developer can debug the application.
Audit Success/Failure these are logs written by the security systems in Windows to log events that have security implications. For example, if you make changes to the Windows firewall the changes you make will be logged here. Think of these as information messages from the security system.
You can see from the '+' to the left of each category that they can be expanded to show the log entry types. In my example above I've already expanded the Critical category and you can see there is only one type of error, a Kernel-Power error (we'll look at what this error actually means in a short while). You can also see that I've had two of these log entries written during the last seven days and one was written in the last hour (these are not additive of course, there are only two of these errors logged on this system).
If I double-click on the Kernel-Power entry the log entries themselves are displayed, you can see this below...

As I select each log entry the box at the bottom displays the contents of the log entry.
Last edited:

